

Heavy industry
Industry & manufacturing
18%
of the monthly peak was avoidable
A steel plant's monthly peak demand (11.4 MW) was driven by the simultaneous startup of furnaces and compressors. Smart control now flattens the load.
Grid & capacity
Keep growing now and skip the grid operator's waiting list.
Match supply and demand locally across business parks.
One microgrid that keeps running on its own during outages.
Peak shaving, storage, backup and market control in one.
Cases
Real results from smart energy management. These customer cases are drawn from our platform's international track record, translated directly into Dutch market realities: euros, household consumption, and local grid impact. We deal in hard data, not stories.
Municipal - generation & consumption
City of Rotterdam - Generation, consumption and operations across the city - spread over separate platforms
97–99%
AI forecast on generation and consumption
The tools already existed: separate dashboards for generation, for consumption and for operations. What was missing was coherence. Rotterdam brought generation and consumption together on EGOS - the Evogrid Operating System that reads, forecasts and steers production and consumption as one.
In the platform
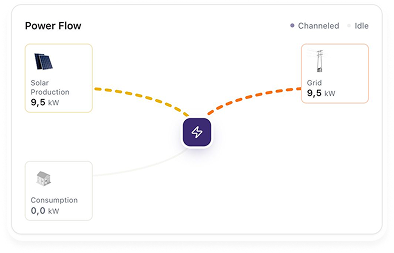
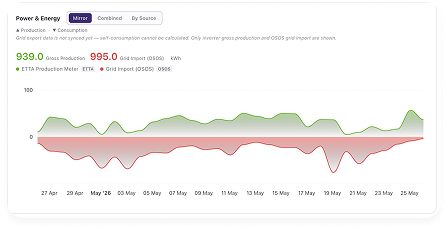
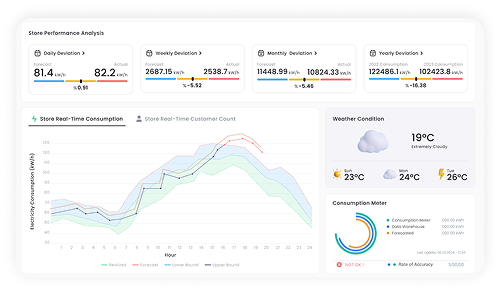
Solar parks, consumption meters and work orders each ran on their own island. Data was abundant - but no system turned it into a single view. Generation and consumption weren't reconciled together, consumption peaks stayed invisible until the invoice, and the step from measuring to one concrete action was missing.
One central control layer over generation and consumption
Whether you are a municipality or an industrial large-scale consumer: fragmented energy systems are a direct financial risk. One overarching control layer forges your entire operation into a single whole. Within today's national grid mechanics, an inaccurate forecast costs you money directly.
Solar & storage
Smart Solar Technologies - Solar developer and EPC contractor operating 242 energy parks across Europe and the Middle East.
+€14.9M
extra generation revenue per year
A portfolio comprising 1.2 GW of solar and 60 MW of battery storage was scattered across eight separate monitoring systems. Without highly accurate hourly forecasts, generated power went unused, and imbalance costs compounded daily. Evogrid unified the entire infrastructure onto a single platform - enabling the assets to monetize themselves autonomously.
Relying on eight different inverter brands meant managing eight separate screens with zero centralized oversight. Hourly financial settlement and day-ahead forecasting were nonexistent. Energy trading and battery dispatch were handled manually. Every missed forecast carried a heavy penalty: resulting in €5.8M annually in imbalance fines and 134 GWh of clean energy generated but never monetized.
In Dutch terms
Leaving 134 GWh of generation unused equals the annual energy consumption of over 50,000 Dutch households. Under TenneT's strict Dutch imbalance regime, every single missed forecast hits your bottom line relentlessly.
Retail - 12,000+ sites
ŞOK - Supermarket chain operating over 12,000 stores, each on a separate grid connection.
−92%
reactive power penalties per year
A massive retail chain operated 12,000+ locations, each with its own individual grid connection. Refrigeration, climate control, and checkout systems draw power 24/7, yet centralized energy management was entirely absent. Evogrid transformed this fragmented network into one highly controllable, portfolio-wide system.
Without centralized, real-time insight at the store and installation level, massive inefficiencies remained invisible. Reactive power was not structurally monitored, triggering up to €1.2 million annually in utility penalties. Furthermore, manually verifying 12,000 energy invoices required 23 full-time employees (FTEs) navigating countless fragmented portals.
In Dutch terms
Dutch large energy consumers frequently face stiff reactive power penalties and fragmented multi-site management. This case proves what centralized control achieves: eliminated waste, avoided fines, and absolute grip at scale. Saving 412 MWh annually is equivalent to the consumption of ~165 households.
Retail & own generation
Migros - Retail chain with 2,000+ stores, 60 MW+ of self-generated solar, and connections across 21 grid operators.
'Best Efficiency Project' - retail sector award
€2.4M
lower energy costs per year
Managing 2,000+ stores, 20+ solar farms, 81 regions, and 21 different grid operators meant energy costs were a chaotic sum of thousands of unverified invoices and conflicting tariffs. Evogrid consolidated the entire operation into one intelligently controlled system - earning the retail sector's highest efficiency award.
With proprietary solar farms, thousands of stores, and 21 grid operators, financial transparency was non-existent. Invoices were simply paid, never validated. Regional tariffs varied wildly, and netting compensation for self-generated power was constantly left on the table.
In Dutch terms
Eliminating 23.5 GWh of unnecessary consumption equates to powering ~9,000 Dutch households for a year. Preventing 11,162 tons of CO₂ emissions provides the exact hard, verifiable data required for rigorous CSRD reporting.
In your sector too
Every industry faces unique energy challenges, but the solution remains consistent: measure, predict, and control automatically. Filter by your field - 23 applications, one platform.
Heavy industry
Industry & manufacturing
18%
of the monthly peak was avoidable
A steel plant's monthly peak demand (11.4 MW) was driven by the simultaneous startup of furnaces and compressors. Smart control now flattens the load.
Food industry
Industry & manufacturing
8
cooling units monitored remotely
A single producer monitors 8 remote cooling units. Faulty units are flagged and repaired well before the cold chain is ever compromised.
Automotive
Industry & manufacturing
CO₂
visible per car produced
A manufacturer maps CO₂ per vehicle produced. Production lines are benchmarked, delivering measurable, audit-ready sustainability reporting.
Data centers
Industry & manufacturing
24/7
critical cooling under control
A data center keeps critical cooling under control. Inefficient cycles and deviating UPS/generator behavior are exposed in real time.
Grid operations
Energy & grids
32 MW
bottleneck predicted days in advance
A 32 MW grid bottleneck predicted days in advance in a highly congested solar zone, making curtailment and flex capacity completely plannable.
Energy producers
Energy & grids
24 MWh
forecast deviation flagged ahead of time
24 MWh in forecast deviations flagged ahead of time, allowing a 96 MW producer to adjust before facing market penalties.
Energy trading
Energy & grids
4.5 MW
of flex monetized in one imbalance peak
4.5 MW of flexible capacity monetized during a single imbalance peak, turning grid volatility into direct revenue.
Offices
Buildings & retail
68%
of HVAC load found after office hours
68% of HVAC load exposed after office hours. Smart meters revealed climate systems running blindly into the night.
Shopping centers
Buildings & retail
185
meters, every tenant on their own bill
185 tenant meters split automatically. Accurate cost allocation prevents disputes, and nighttime baseline anomalies stand out instantly.
Hotels
Buildings & retail
210
rooms without hidden consumption
210 rooms without hidden consumption. HVAC and kitchen base loads outside guest hours are actively flagged.
E-mobility
Mobility & transport
400
charging points under smart control
400 EV chargers dynamically controlled. Smart charging shifts peak loads to keep sessions running safely within the grid connection limit.
Logistics
Mobility & transport
65
electric forklifts without peak penalties
65 electric forklifts charged without peak penalties. Automated load shifting ensures full batteries without tripping the main fuse.
Public transport & rail
Mobility & transport
18
stations and depots in one view
18 transit stations and depots monitored centrally, tracking peak demand across escalators, lighting, and bus charging.
Airports & ports
Mobility & transport
120
metering points, from terminal to crane
120 metering points actively managed, isolating simultaneous peaks from baggage belts to massive shore power connections.
Hospitals
Healthcare & public sector
320
beds, zero compromises
320 beds, zero compromises. Continuous readiness monitoring for backup generators, UPS units, and critical ICU infrastructure.
Care facilities
Healthcare & public sector
180
resident rooms, comfort assured
180 resident rooms optimized for comfort and safety. Unnecessary base loads are eliminated while backup systems are strictly verified.
Municipalities
Healthcare & public sector
86
public buildings on one budget
86 public buildings consolidated into one budget. From sports halls to city offices, expensive anomalies are caught and sustainability targets are proven.
Universities
Healthcare & public sector
24
campus buildings compared side by side
24 campus buildings benchmarked side-by-side. Labs and lecture halls are optimized to hit aggressive CO₂ reduction targets.
Greenhouse horticulture
Agri & housing
12
climate zones in balance
12 climate zones perfectly balanced. Heating, cooling, and lighting are orchestrated for a stable crop climate and a sharpened energy profile.
Agriculture with own generation
Agri & housing
2.4 MW
of solar and CHP deployed smartly
2.4 MW of solar and CHP intelligently dispatched. Surplus is stored, consumed, or traded - maximizing flex value.
Housing cooperatives
Agri & housing
320
apartments, transparent costs
320 apartments with transparent billing. Common area consumption, EV chargers, and rooftop solar are flawlessly allocated.
New-build districts
Agri & housing
14
housing blocks without a local bottleneck
14 housing blocks avoiding local grid bottlenecks. The platform balances EV charging, heat pumps, and household loads dynamically.
Residential districts with solar
Agri & housing
480 kW
of solar and 36 charging points matched locally
480 kW of solar intelligently matched to 36 EV chargers, drastically increasing self-consumption and reducing neighborhood grid strain.
Track record
Every single case above is driven by our AI forecasting engine - operating day in, day out, across 2 GW+ of generation and 14,000+ connected sites.
97%
Generation
97%
Consumption
98%
Price
99%
Grid delivery
AI forecast accuracy on generation, consumption, price and grid delivery.
We model the solution using your actual business data to show the precise ROI upfront. The final decision is yours.
We use Google Analytics to anonymously measure how the site is used, so we can improve it. Analytics stays off until you agree. Read our privacy policy